AMG Kernel originates and filters calculable visualizations of changing values and sentiment with trusted market data:
AMGUI visualizes changing cash flows and share levels in market vectors that measure changing demand sentiment; professional portfolio data and mutual fund (including ETF) new cash investment flows metadata.
Subscription: Fiduciary's Virtual Private access to continuous market data connects with software and services (AWS QuickSight, SalesforceTableau, and ad hoc integration): Interactive dashboards visualize continuous Financial market sentiment as overlays for open-end fund market value vector paradigms of real investment cost and expected value of securities.
The visualizations form templated analytics to non-Financial and unregulated verticals (Media, Tech, Social, Rideshare, Determinative....); where changing sentiment is also relevant and important.
Safe harbor rule 28(e) protected securities market research augments legacy market data analytics of shares and prices to visual analytics of change in securitized asset vectors that interactively template quantitative measures of value to qualitative notions of sentiment.
The kernel data sources the capital asset metaphor to infer trusted value from regulated filing submissions.
Secure Private/Shared Repositories for overlays store changing professional portfolio share levels and mutual fund investment flows as dollar-driven paradigm vectors of market demand data.
The dashboard analytics visualize interactive 'etch-a-sketch' projections of sentiment in structured dimensions where shared questions and commonly understood changes in market values are continuously measured.
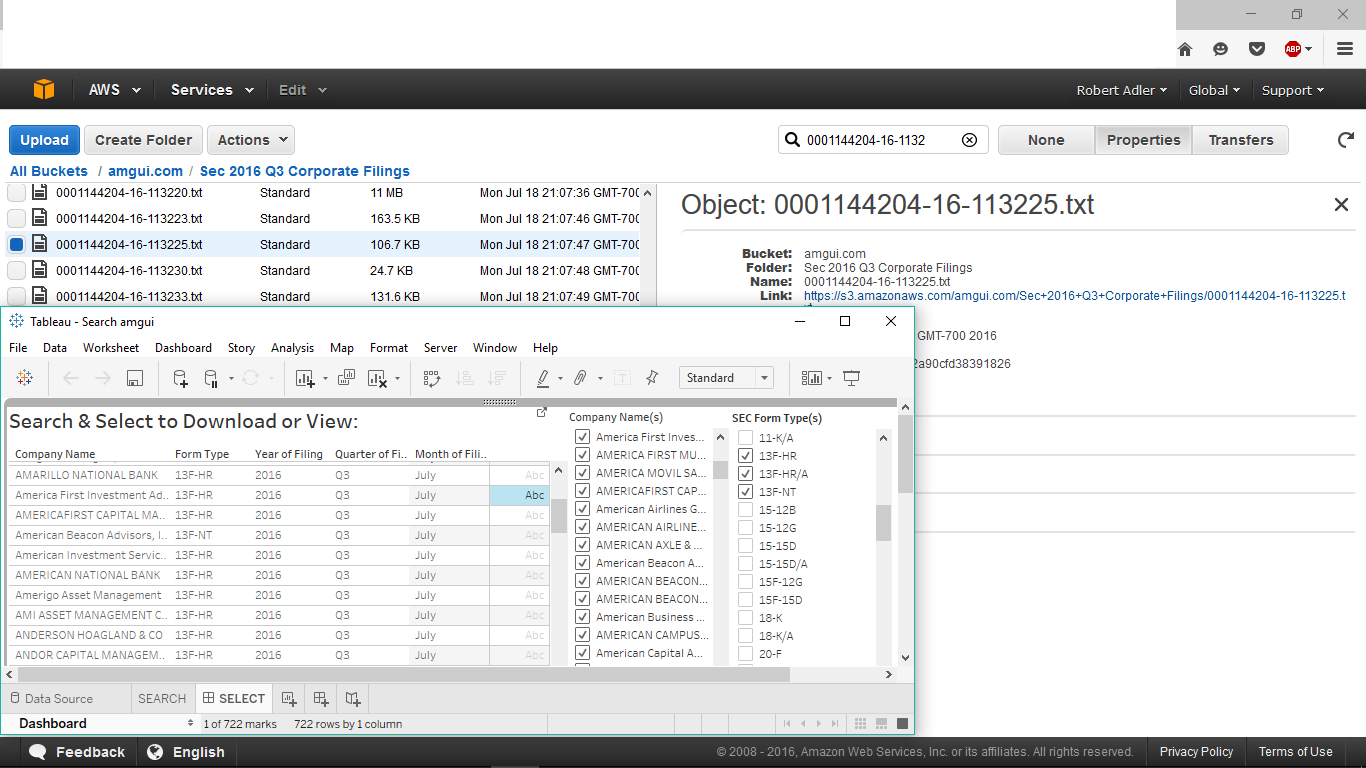
Asset, price, share, and position data are sourced in millions of regulated EDGAR filings by thousands of entities submitting continuous values in fixed intervals to https://SEC.gov.
The data and metadata visualize (portfolio asset/share) levels and (mutual fund and ETF) investment flows, multidimensional data sets of Financial sentiment vectors of dollar-driven values and extend unique Fiduciary's analytics of the market data and metadata to any (Financial and non-Financial) structured dimension or topic.
Access to the EDGAR public filings insures continuous regulated valuation of changing securitized levels and flows and Trues the interactive dashboard to uniquely 1) visualize transactional changes in market sentiment, and personally 2) template the analyses to non-Financial structures that apply the Capital metaphor of asset and price changes in the valuation of any structured asset; securitized, real, cash, or determinative.
Interactive dashboards project continuous values in open end fund asset data dimensions that are not related to fundamental earnings performance estimates and measurements, but augment the fundamental data for uniquely enhanced safe-harbor data analyses.
Data analytics of portfolio ownership changes filter SEC 13F and other portfolio form types (Access to 300+ SEC form types) on flexible VPN subscription subnets using AWS cloud services, Tableau-like visualization features, ad hoc integration, and legacy market data platforms to advance custom visual analytics;
Salesforce training with extensive learning resources is freely provided by Tableau including tools for some preparation of disparate sources of data; or AWS Athena, eg..
The AWS QuickSight and SalesforceTableau prototype features connect to transformed market data and metadata overlays to derive templated visual analytics of non-Financial and unregulated structures in the data view.
AWS seamlessly integrates essential cloud services to visualize the signals residing in market data overlays of changing asset levels and flows to derive templates, and train AI.
Services are secured at login for the fiduciary's unique subscription design for AWS IAM credentials and security groups, eg.
The capital market sentiment vector overlays are predictive of changing sentiment in Financial, non-Financial, and unregulated vectors of value where qualitative notions of sentiment are relevant, meaningful, and matter.
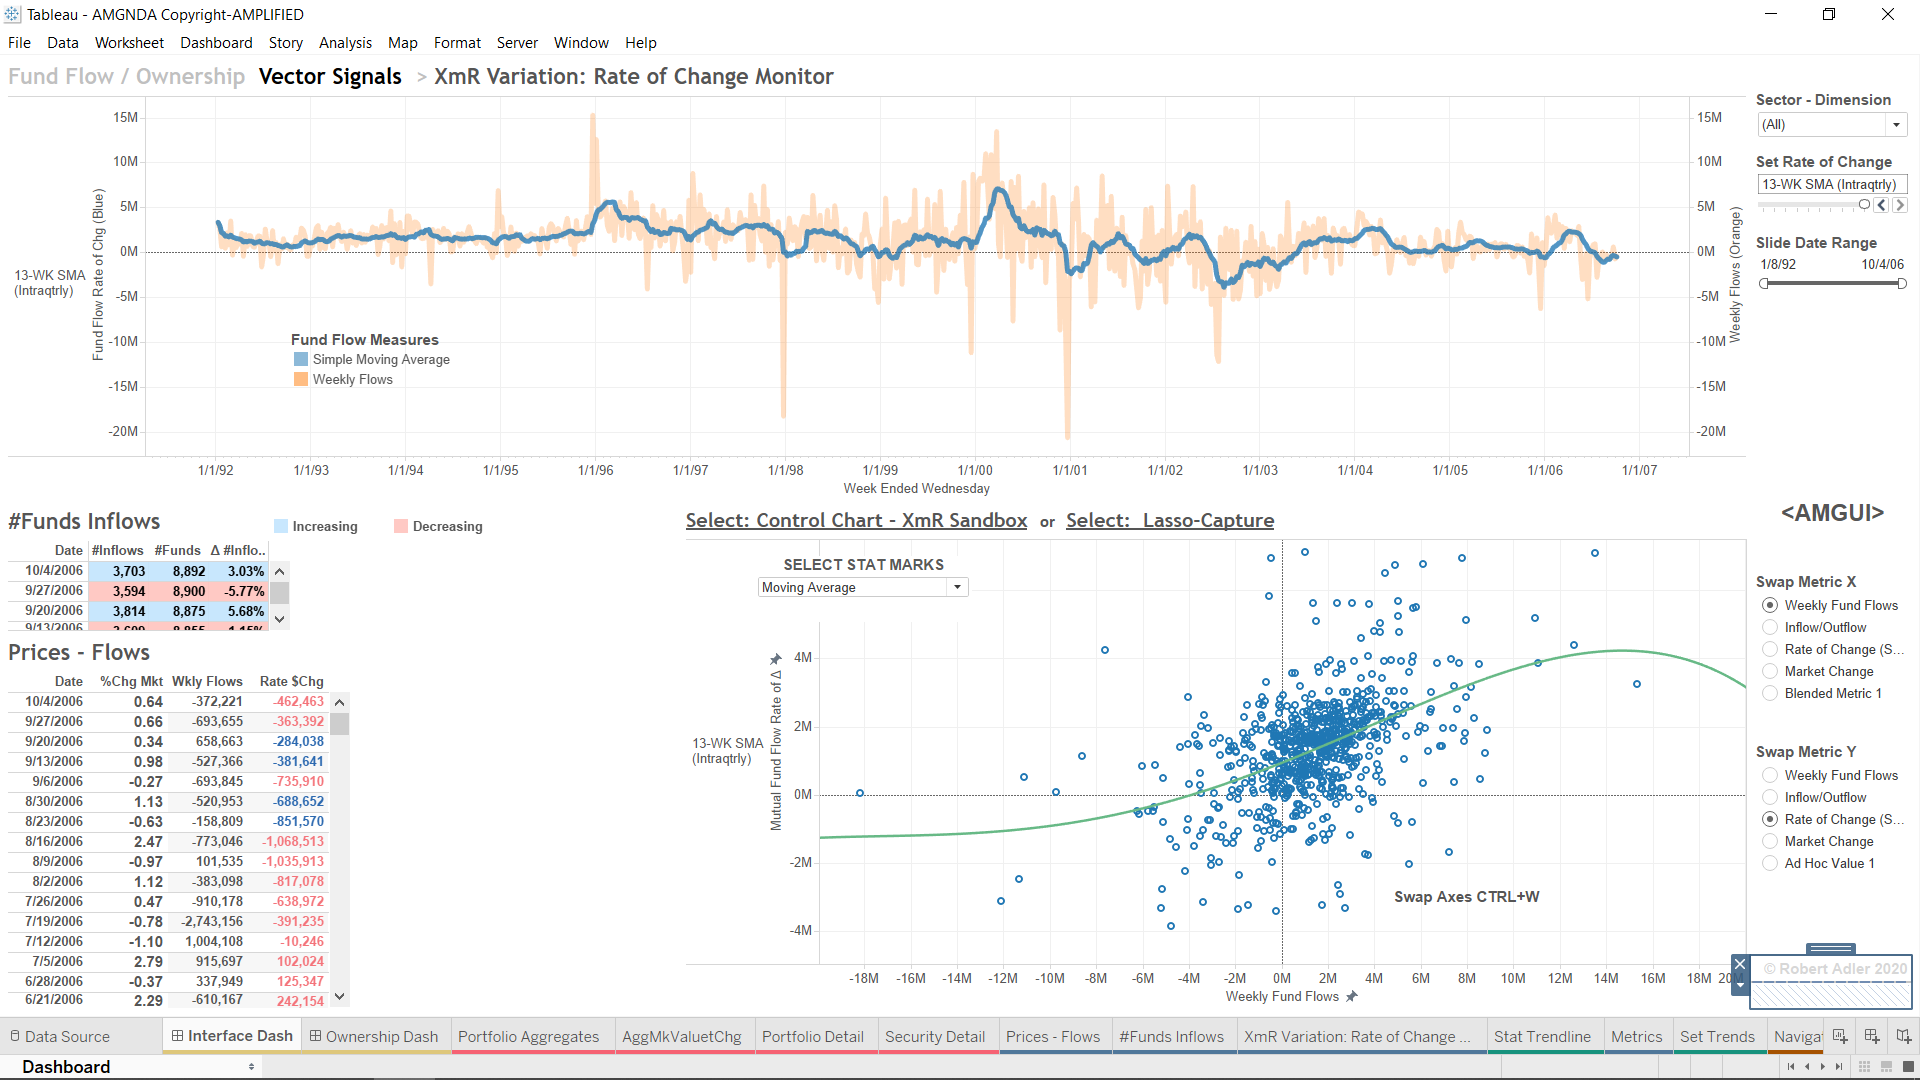
AMGUI market data model uses investor'Fund flow' analytics to compute changing market demand for equity mutual funds (xETF,+ETF, ETF only) ranging 769 weeks, 1992-2006; structured to connect continuously to 2025 weekly data updates.
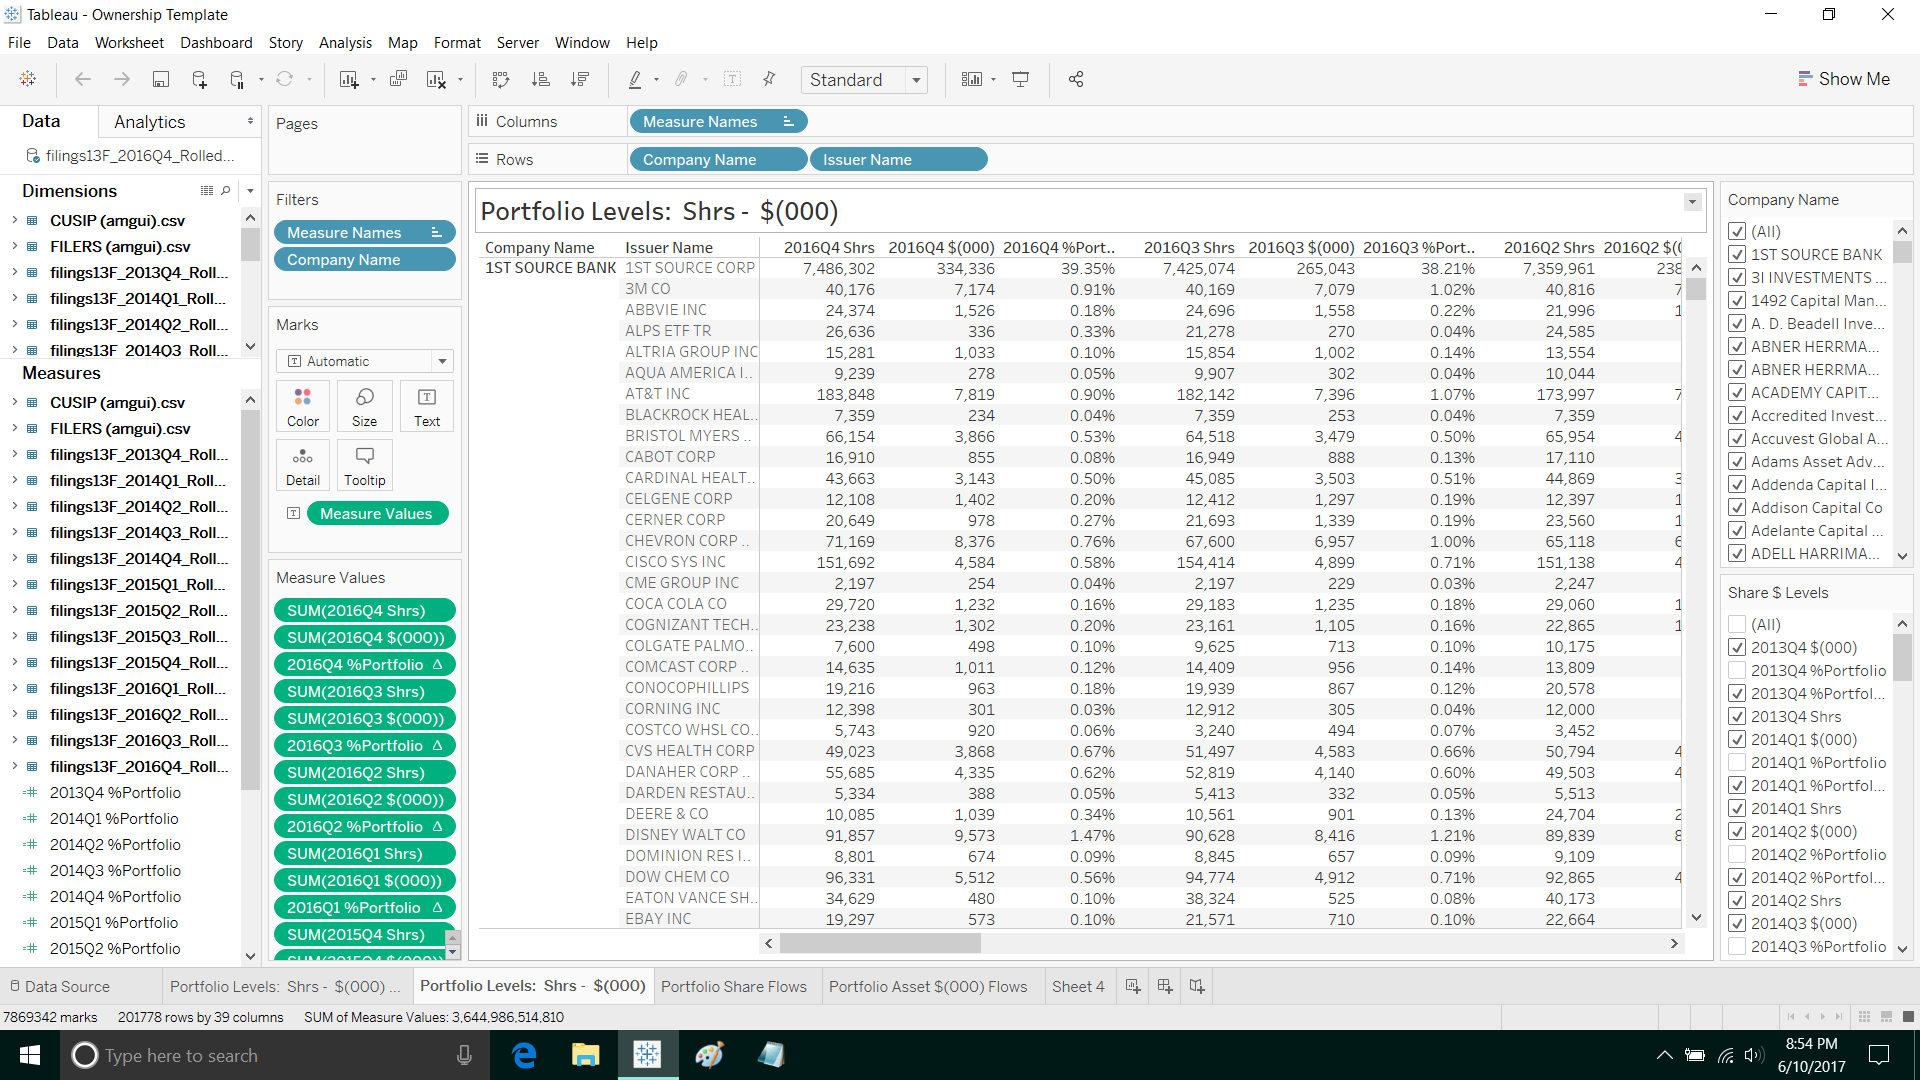
Tableau templates of time-series 'Ownership' data analytics compute changing soft (expected) price levels; and hard (real) asset flows: 'Fund flow' metadata analytics of continuous mutual fund (including ETF) net investment dollars.Visualizations are framed to query each unique story saved and sustained in the changing views.
Unique Fiduciary subscription overlays enable flexible development of position, orientation, and data marks including color, size, shape, etc. of blended datasources, to expand the import of the visualization beyond numeric results, and add value to the fundamental stories sustained (embedded) in the data view.
Perspectives of events are also viewed in flexible time intervals; and extend from seasonality, calendar date, rates of change, trendlines, and other statistical marks.
AMGUI overlays denormalize and blend regulated data sources to compute managed asset levels and mutual fund flows, reported across multivariate frequencies (intervals) of changing market data action.
Multiple chart types are used to tell unique stories within a context of time and events that may not be apparent in the timeline.
The interface design extends the private cloud to open scripting, regular expressions, calculated values, and fundamental market data.
© 2025 Robert Adler TXu 2-489-251 Amplified, All Rights Reserved